Year 7 (age 11-12)
…had an Independent homework this week and I was really pleased with the variety of choices made. Some chose to use online resources / their text to practise a topic tested recently, others worked further on some investigations we have looked at in class, some chose to do a Junior Maths Challenge. A couple of students used the Diagnostic Questions site to practice their chosen topic. One of the investigations we have looked at recently was on the number of winning lines in a noughts and crosses game – the 2 dimensional game was fairly quickly sorted out – so moving to 3 dimensions is the natural extension.
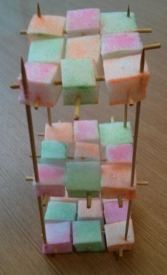
Some were fascinated by this and determined to find the number of winning lines in a game of 3D noughts and crosses – two students so keen that they made a model of their own to help them answer the question successfully! They made some counters as well!
I have read some great posts on feedback recently, see Alex Quigley’s Improving Written Feedback and Verbal Feedback Given….. on Shaun Allison’s ‘Class Teaching’. Such a good idea, I couldn’t resist – so I bought myself the stamper and decided to try this with Year 7 – early days yet, but I love the idea so far..
Another student in the same Year 7 class mentioned above was determined to find the number of winning lines in a game of 3D noughts and crosses which she did successfully. She drew some clear sketches of the different groups of winning lines and after a discussion with me was the recipient of my first stamp! I was very enthusiastic about her written work on this as you can see from her response! I had explained to the class that if I discuss their work with them, then give them a stamp – they have to write down that feedback as Shaun suggests in his post.

Year 10 (age 14-15)
 Year 10 and I have been looking at inequalities – using algebra and graphs. After a ‘self-check’ (somehow that sounds so much better than test and the emphasis is very much that it is useful to see what they can recall) in class, the feedback from the students was that most of the questions were fine but any problems seemed to be on working out the equation of a line when trying to describe a given region. The wonderful Desmos graphing calculator to the rescue – this page allows students to experiment with several variables. (Post for students here.)
‘
.
.
.
,Update – since writing this post, along came Desmos…

and created a superior version! This shows many of the awesome Desmos features. I really must explore these further – note that where a folder is used selecting the arrow shows or hides the contents. This is a brilliant feature for creating pages to share with students.

Gradient of a straight line by Desmos
I mentioned feedback from the students – a simple feedback idea – I asked this class as the first part of a homework to email me with any outstanding queries from the mini test, having looked at the worked solutions on our homework blog. I have been impressed by their understanding and articulation of what they initially found tricky.
Year 12 (age 16-17)

zweigmedia – numerical integration utility
In Year 12 we have been studying integration. Teaching the trapezium rule I remembered some applets I used last year which demonstrate this well.

Graphs on WolframAlpha
The Year 12 Further Maths class are currently studying Decision Mathematics and a student asked what WolframAlpha can do?! Looking at the examples we can see that describing connections between nodes will generate images of a graph. I must explore further!

Normal Trainer – Mike Hadden
Year 13 (age 17-18)
Studying the Normal Distribution I showed students Mike Hadden’s excellent normal trainer which generates an endless supply of examples. I really like the step by step approach and the very clear page on the backwards problems.
With the Year 13 Further Mathematicians I was reminded of the huge variety of Tarsia puzzles around and that these are not just for younger classes. In Year 13 we use a Tarsia on De Moivre’s theorem.

 t is also possible to define a function with more than one argument and use Desmos as a calculator